

Dashboard Data-vis Fintech Prototype
Fund investment portfolio construction tool
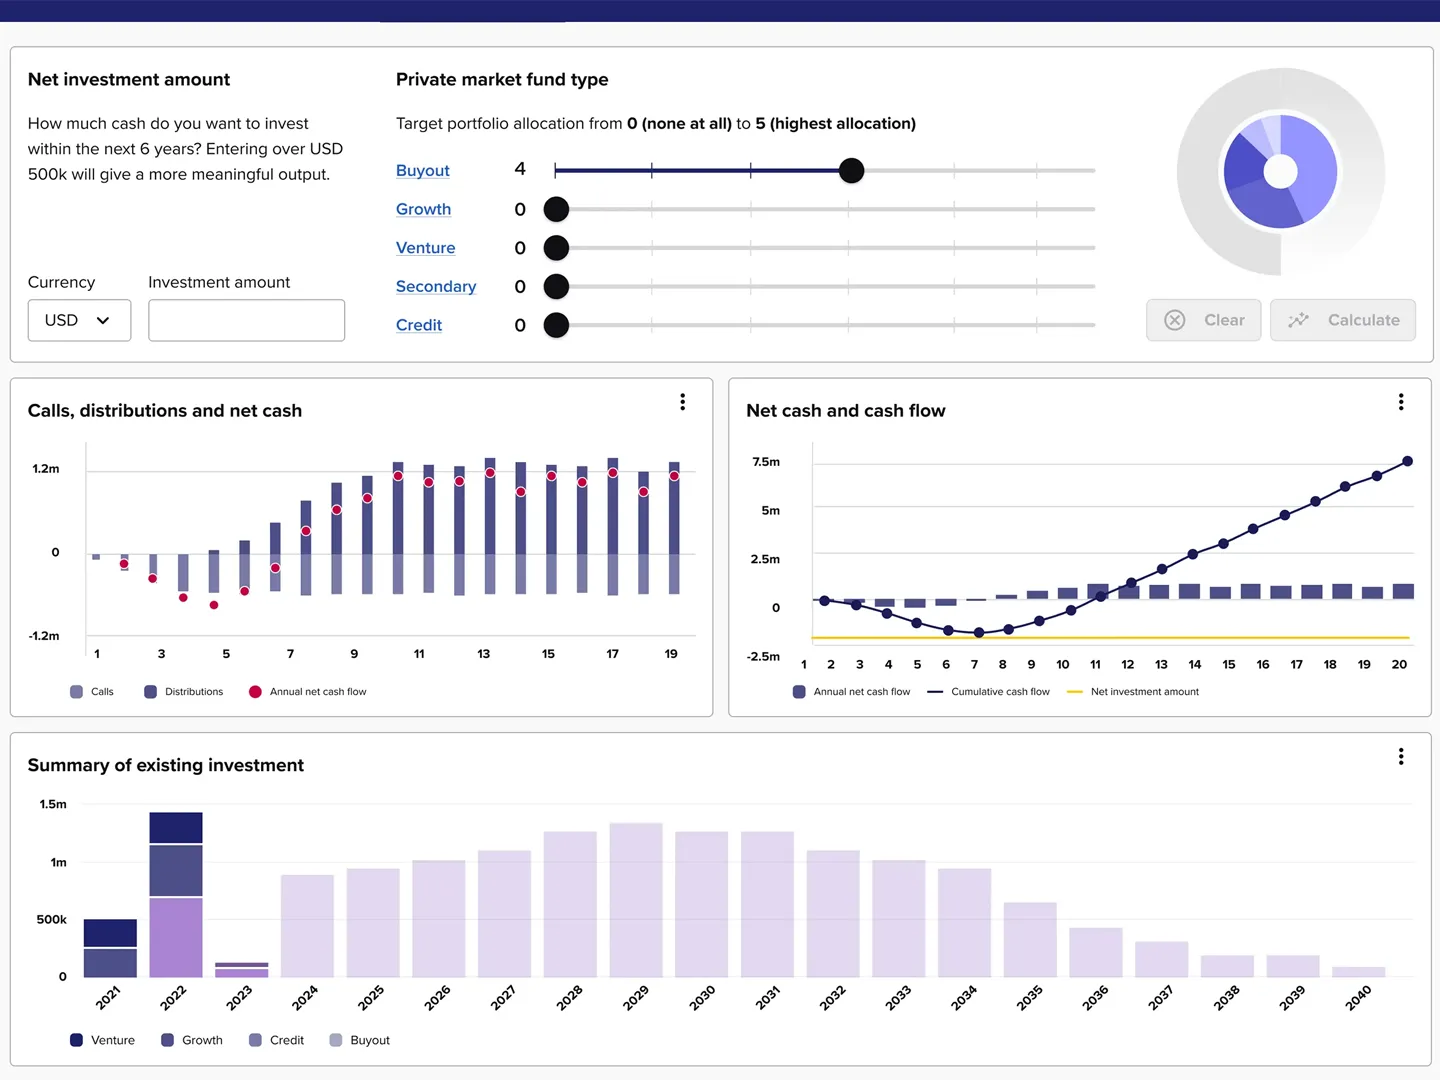
Try thisMove a slider and watch the whole cash-flow picture move.
Context
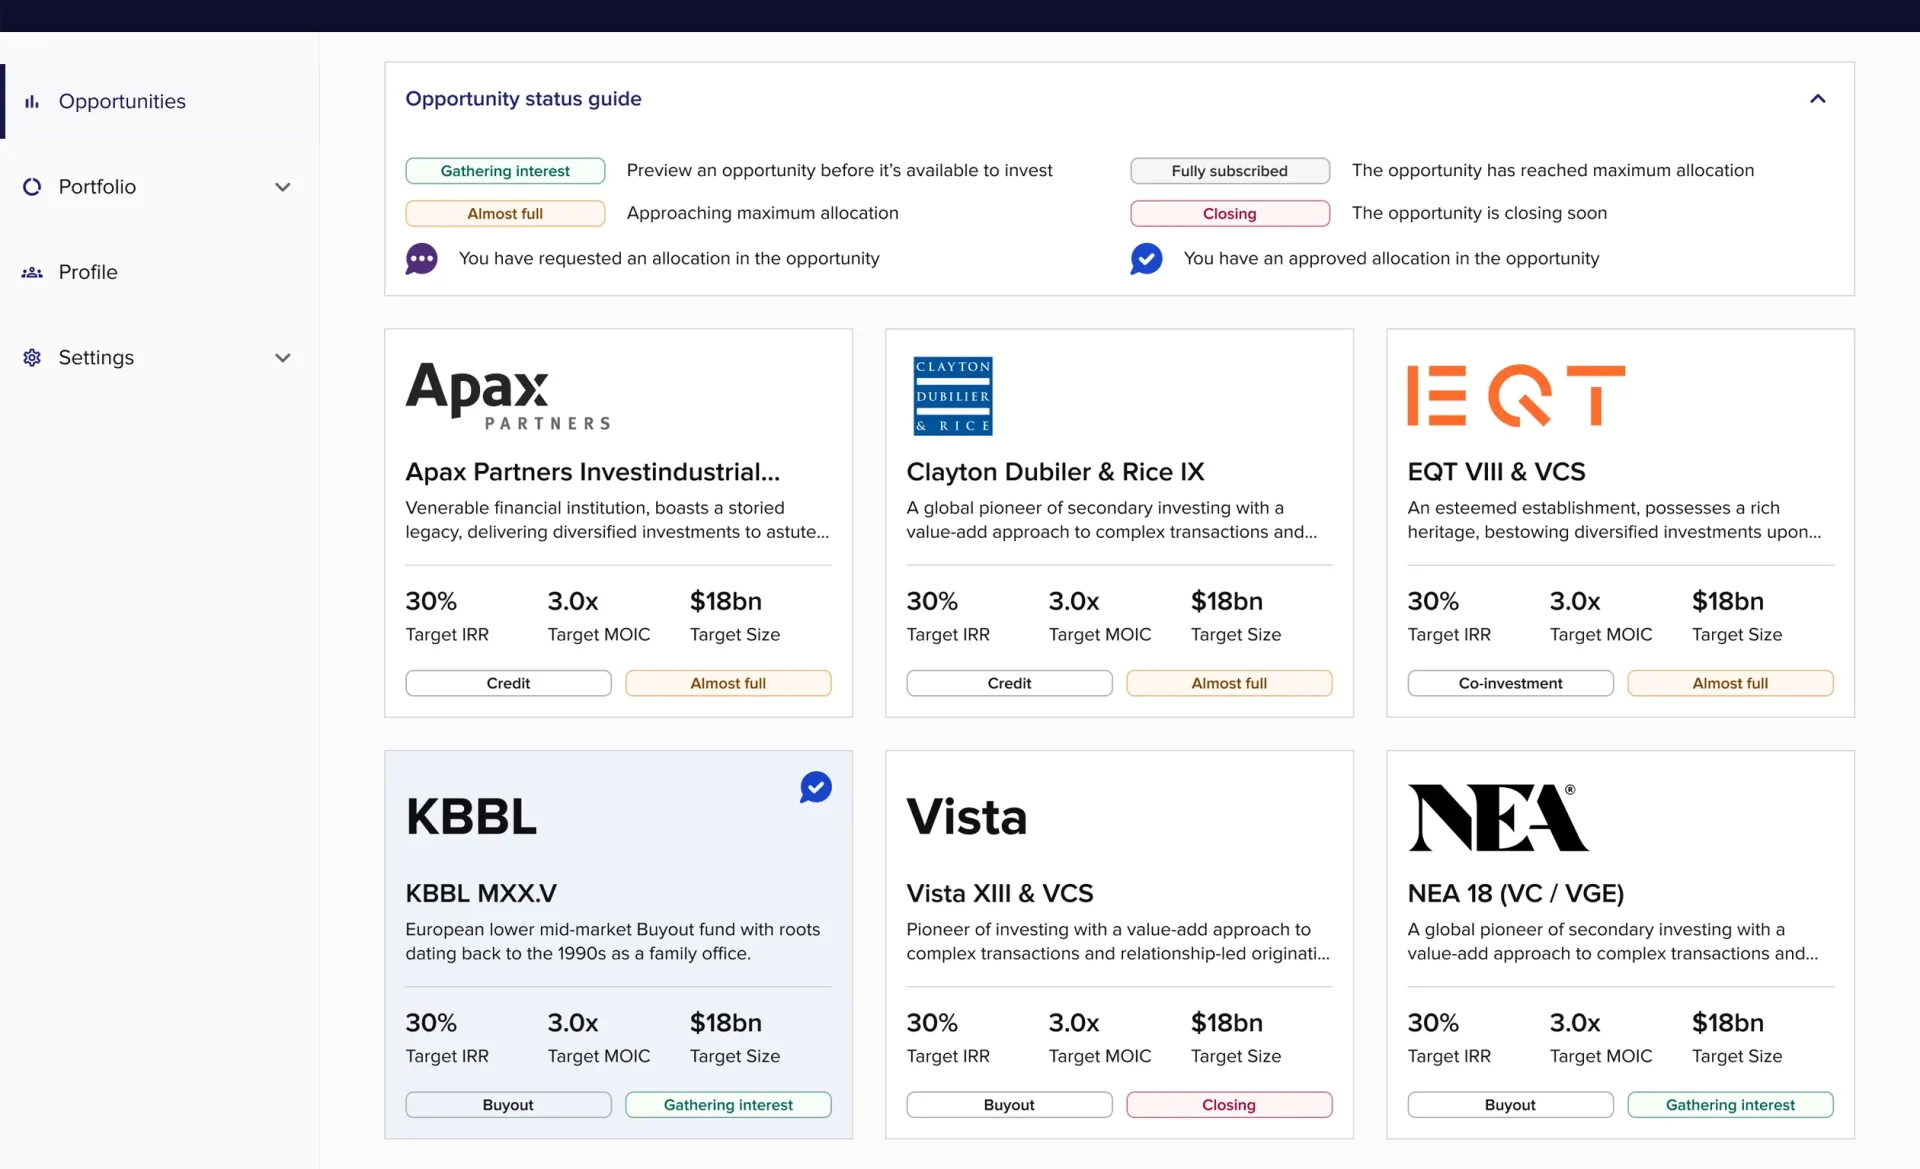
A private markets investment platform serving both institutional and private investors, where clients build diversified multi-strategy portfolios and access funds normally closed to them.
The decision
Could non-specialist investors construct a credible private-markets portfolio on their own and trust what the numbers were telling them about pacing, cash flow and risk?
What was prototyped
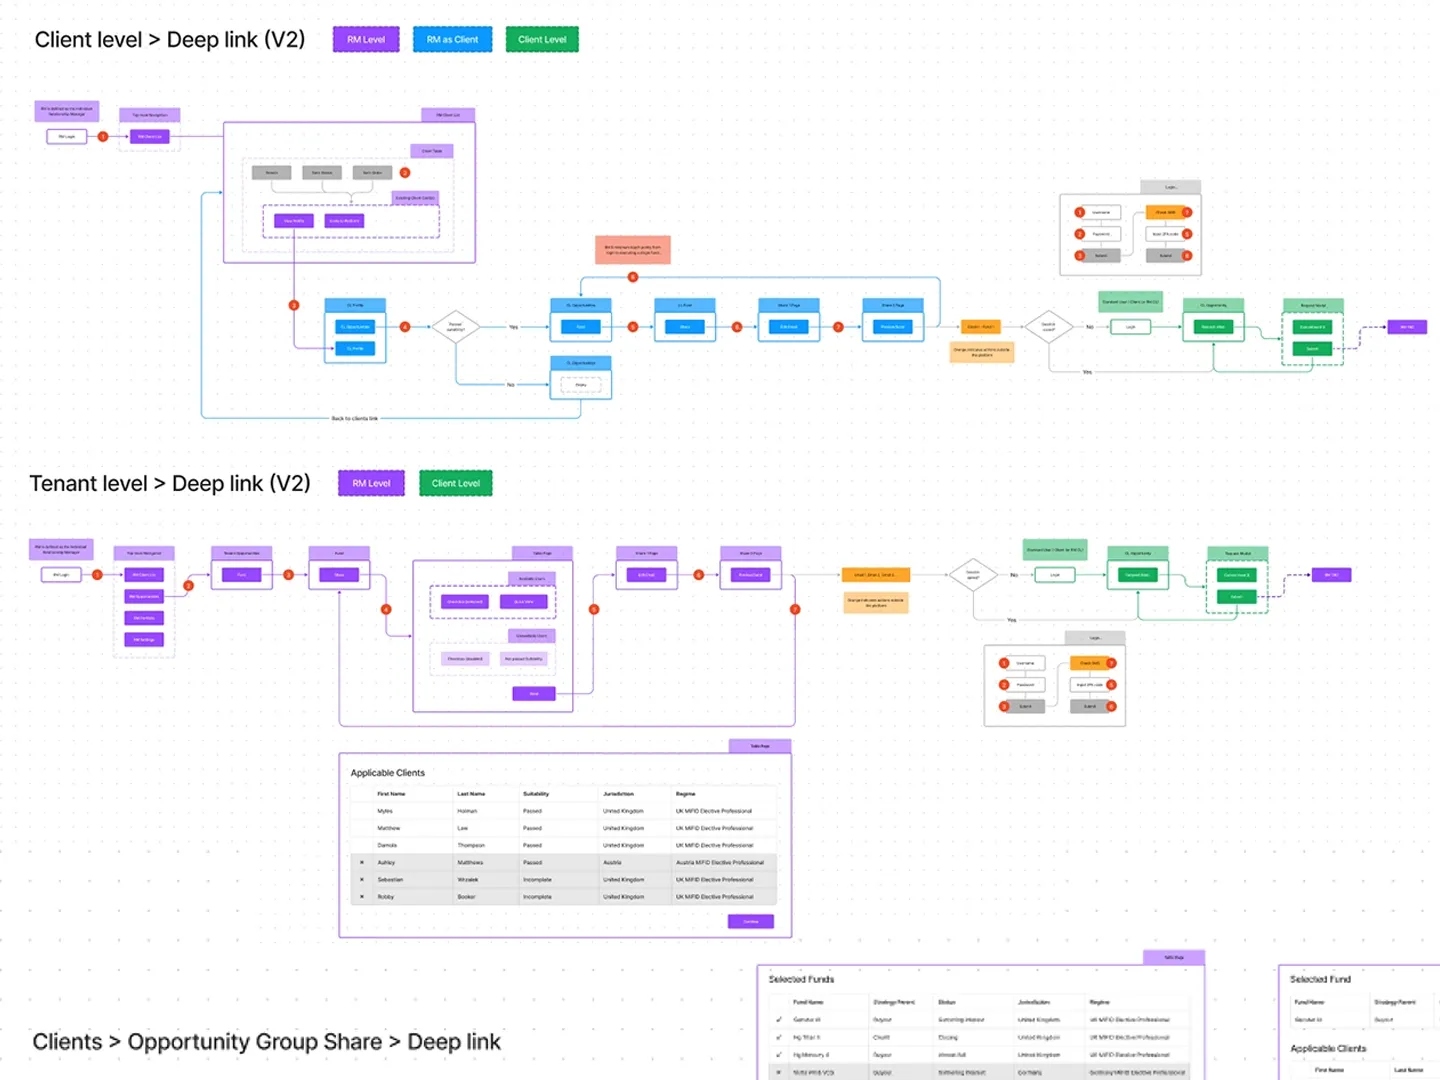
The full construction flow as working software: investment amount and currency, five strategy sliders driving a live allocation donut and a constructed portfolio view with summary terms and three interactive charts. The figures aren’t decoration: a real pacing and cash-flow model runs underneath, so every chart, tooltip and “max cash at risk” number is computed from the inputs. Changing anything marks the results stale until the portfolio is reconstructed.
What it demonstrates
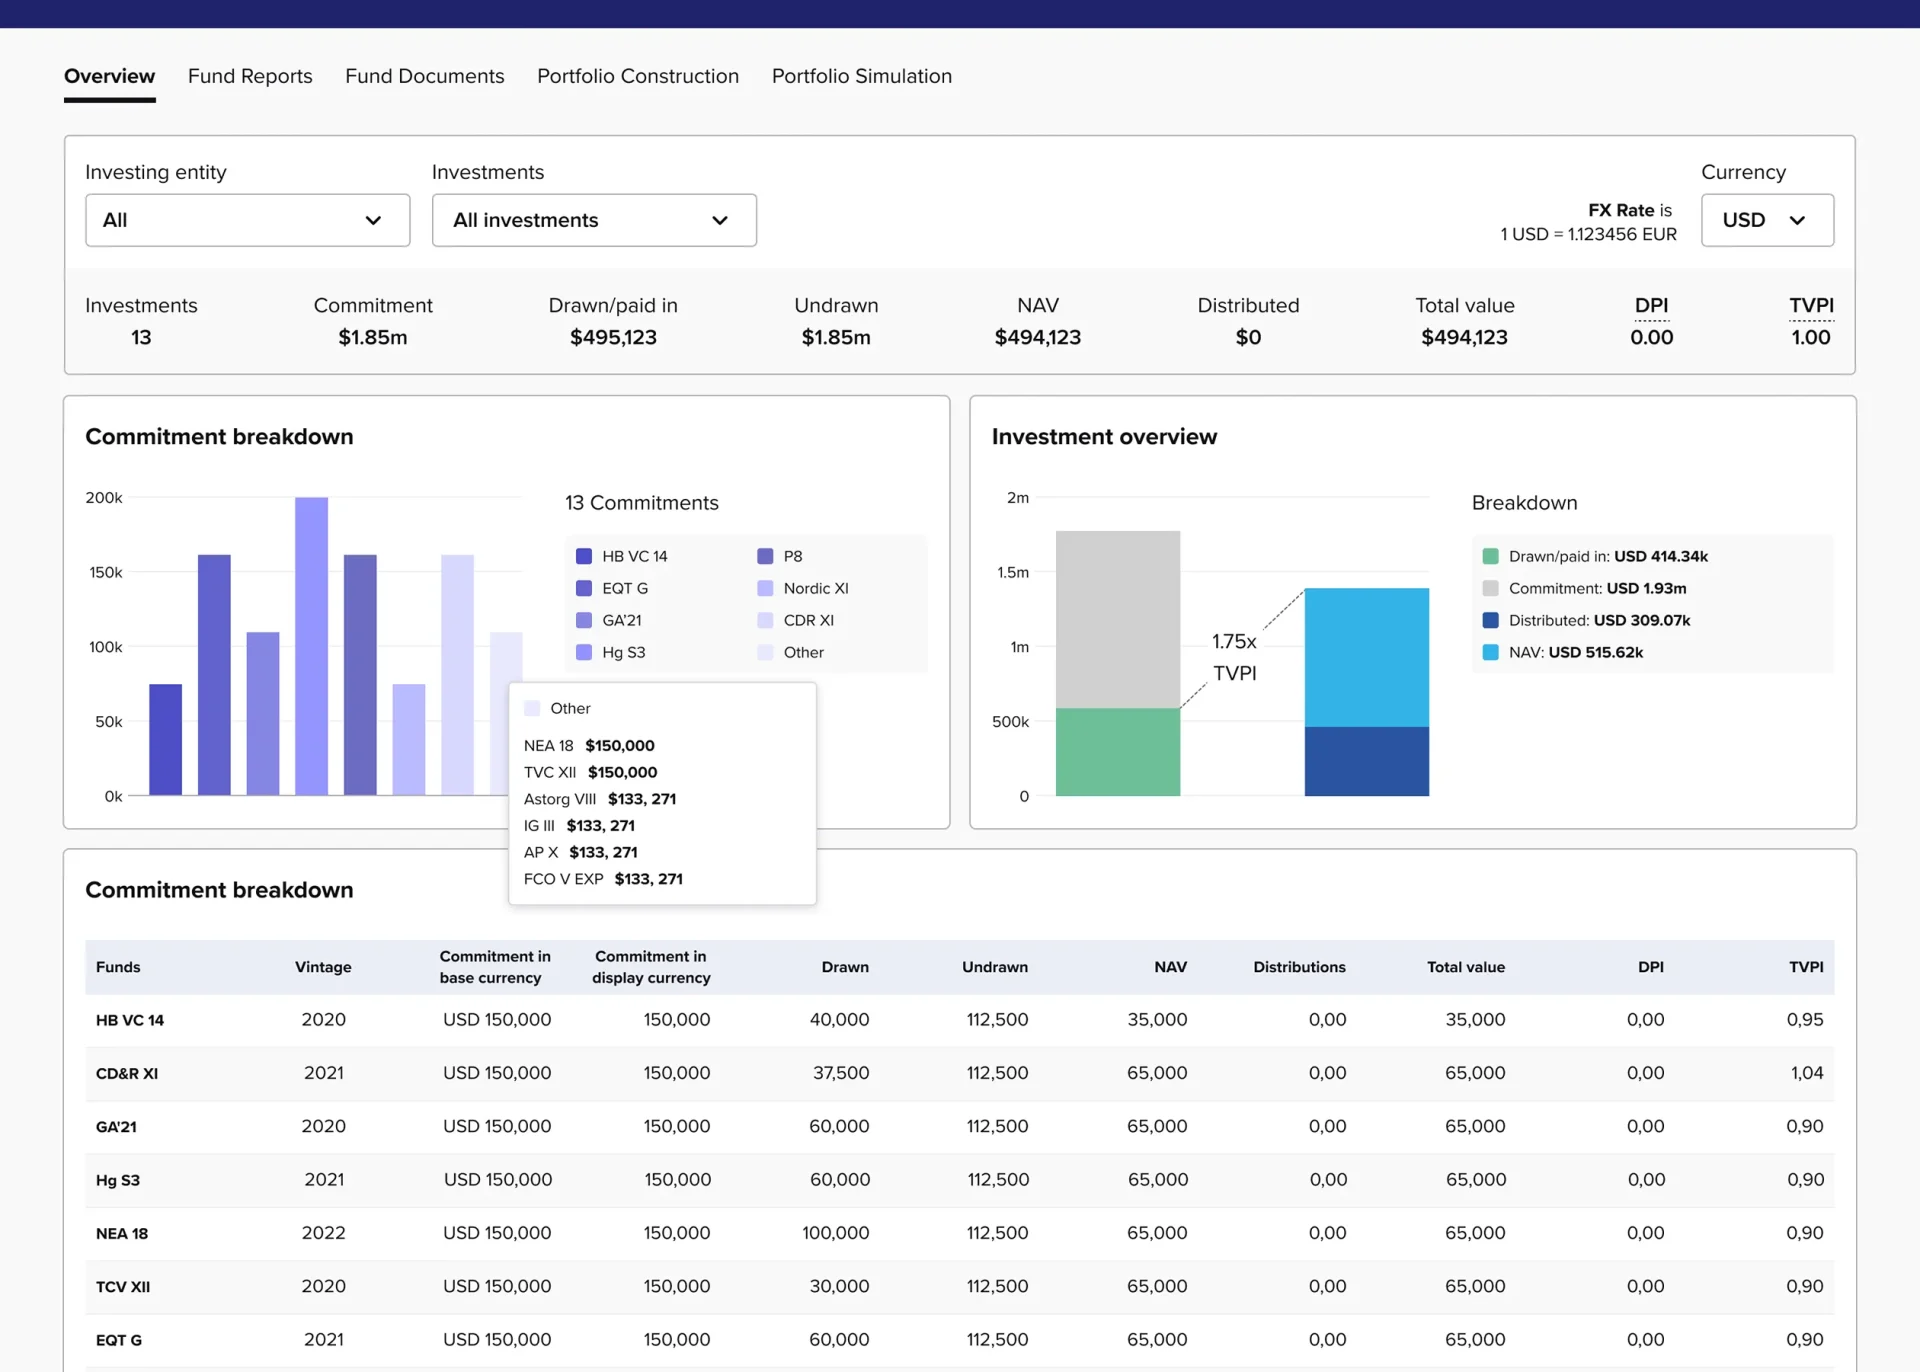
Model-driven realism a stakeholder can interrogate rather than canned screens: change an input and every figure downstream of it moves. Accessibility as a default, with a table twin behind every chart and a keyboard path to every tooltip. Dense financial data-visualization built to answer the model rather than a charting library’s defaults. And a desktop-only design given a considered responsive life down to one column.
Reconstructed from client work using synthetic data.
Change one input and see what goes stale.